Softhouse Turns Data into a Competitive Advantage with Cinode and Power BI

Data alone holds no value—unless it can be used. That’s what Softhouse realized when they sought more control over utilization, sales, and profitability in their consulting business. Despite having access to large amounts of information, analysis often got stuck in static Excel reports and manual processes.
But by using Cinode as a data source and Power BI as the analytics engine, they’ve now built a solution that provides both a helicopter view and operational insights—in real time.
“I’ve always seen the potential in our data, but lacked the right tools and skills to put it into action. With Cinode connected to Power BI, I know what questions to ask—lead times disappear, and insights increase,” says Erik Sylwan Ahrholt, CFO at Softhouse.
Softhouse has used Cinode for several years to ensure the right consultant is matched with the right assignment. Previously, they exported data to Excel, which didn’t provide an overall picture or enable in-depth analysis.
“The reports were static. I wanted to explore the data from different angles, follow up on goals, and above all, understand why things happen—not just that they do,” Erik explains.
Real-Time Tracking
By integrating Cinode with Power BI, data is automatically retrieved several times a day, giving Softhouse a continuously updated and accurate real-time view of the business. Power BI transforms Cinode’s data into interactive dashboards that provide insights into everything from utilization and revenue per consultant to sales, projects, and profitability.
“I can see how many deals are in progress, who’s closing them, and how that impacts the coming months. It gives us a completely different decision-making foundation,” says Erik.
Aligning Sales, Delivery, and Utilization
The integrations between Cinode and Power BI create a seamless data flow across the entire consulting operation. This enables, among other things:
- Visualizing sales opportunities and pipeline per salesperson
- Better forecasts for both utilization and revenue
- Conversion rate analysis over time—what leads to deals, and why?
- Integration with systems like Visma PX to track the process from sales to delivery
“When data becomes accessible to everyone, it triggers a positive cycle—data quality improves, and more data gets added. We save time and spark curiosity among our managers and consultant leads,” says Erik.
Understanding the Story Behind the Numbers
For Erik, simply showing numbers isn’t enough. What matters is understanding the story behind the results.
“Many focus only on the outcome, but that’s just a consequence. The important thing is understanding what drives it. That’s why accurate data and clear visualizations are essential.”
With Power BI, Softhouse has built dashboards that make it easy for managers to track their teams, for project leads to monitor profitability, and for sales to stay on top of conversion rates and pipeline status.
Building Shared Understanding
For Softhouse, working data-driven isn’t just about efficiency—it’s about creating a shared understanding in a decentralized organization. The group consists of ten independent companies, each with significant autonomy. While this fosters drive, it also makes it harder to see the bigger picture.
“We have many companies with strong individual identities. Previously, people mostly looked at their own region or customers. Now, we can visualize the big picture—who we work with, how business is developing, and how our goals are connected. It builds insight and understanding across the companies,” says Erik.
With Cinode as the hub for business and utilization data, and Power BI as the visualization tool, Softhouse has created more than a control system—they’ve built a culture where data connects people and creates shared direction. And when more people understand the whole, it also becomes easier to act on the details.
Relevant in Everyday Work
The key to making the solution work in practice is that it saves time—it doesn’t create more work.
“It should never be about entering data just for my sake. The information has to be relevant in people’s daily work, or it won’t last,” Erik emphasizes.
With better data structure and accessible reports, he sees more people in the organization naturally using numbers in their daily work.
“People start asking questions like ‘What does this mean? How does it connect to what we do every day?’ That’s exactly where I want us to be.”
Mattias Loxi, Co-Founder / CMO
Mattias Loxi, Co-Founder / CMO
You may also like...
All posts
Dec 05 2025 · Cinode
⚡ From Incoming Email to the Perfect Consultant in Seconds – How Cinode’s AI Streamlines the Process

Nov 05 2025 · Cinode
Stay on top of your deals and consultants – directly in Slack or Teams

Oct 31 2025 · Reference case
How Logikfabriken Leverages MCP and Cinode to Drive Sales and Resource Efficiency
Oct 24 2025 · Cinode
Use AI to chat directly with Cinode – thanks to MCP (Video)
Oct 03 2025 · Cinode
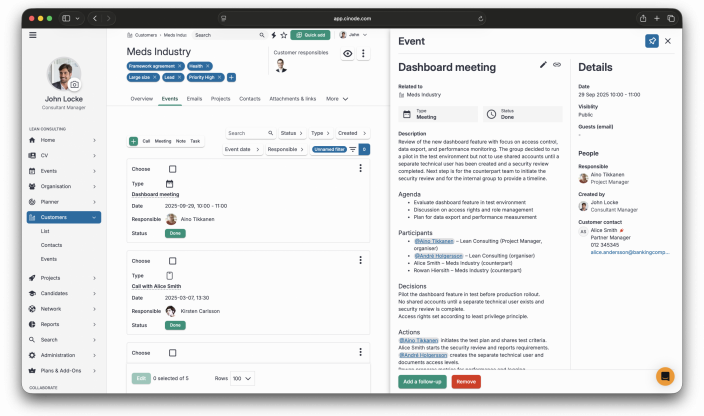
AI Notetaker in Cinode – Meeting Notes on Autopilot
Sep 23 2025 · Cinode
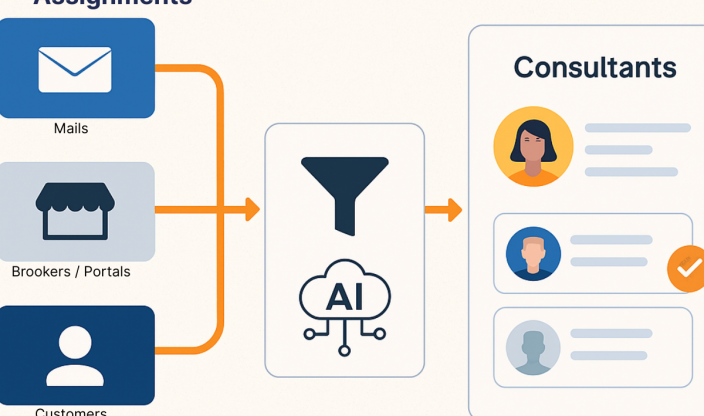
All Public Consulting Assignments – Collected, Filtered, and Matched with Your Consultants

Sep 12 2025 · Cinode
Pipeline Assistant Creates Data-Driven Sales Focus at Frontit

Aug 21 2025 · Cinode, Consulting
🚀 A Clear View and Fast Execution – Our Journey with Cinode

Aug 15 2025 · Cinode
Cinode Named Grid Leader by G2 – Multiple Top Awards in Summer 2025

Jun 27 2025 · Cinode, Reference case, Referenscase
A Decade with Cinode – Empowering XLENT to Grow with Speed, Focus, and Precision

Jun 26 2025 · Cinode
Meet Cindra – Your New AI Sidekick in Cinode! 🤖✨
May 16 2025 · Cinode, Uncategorized
